System Overview
Trinity provides a real-time operational layer for monitoring, managing, and interacting with your agent fleet. The Dashboard, Operating Room, and monitoring systems give operators full visibility into agent activity, health, and collaboration.
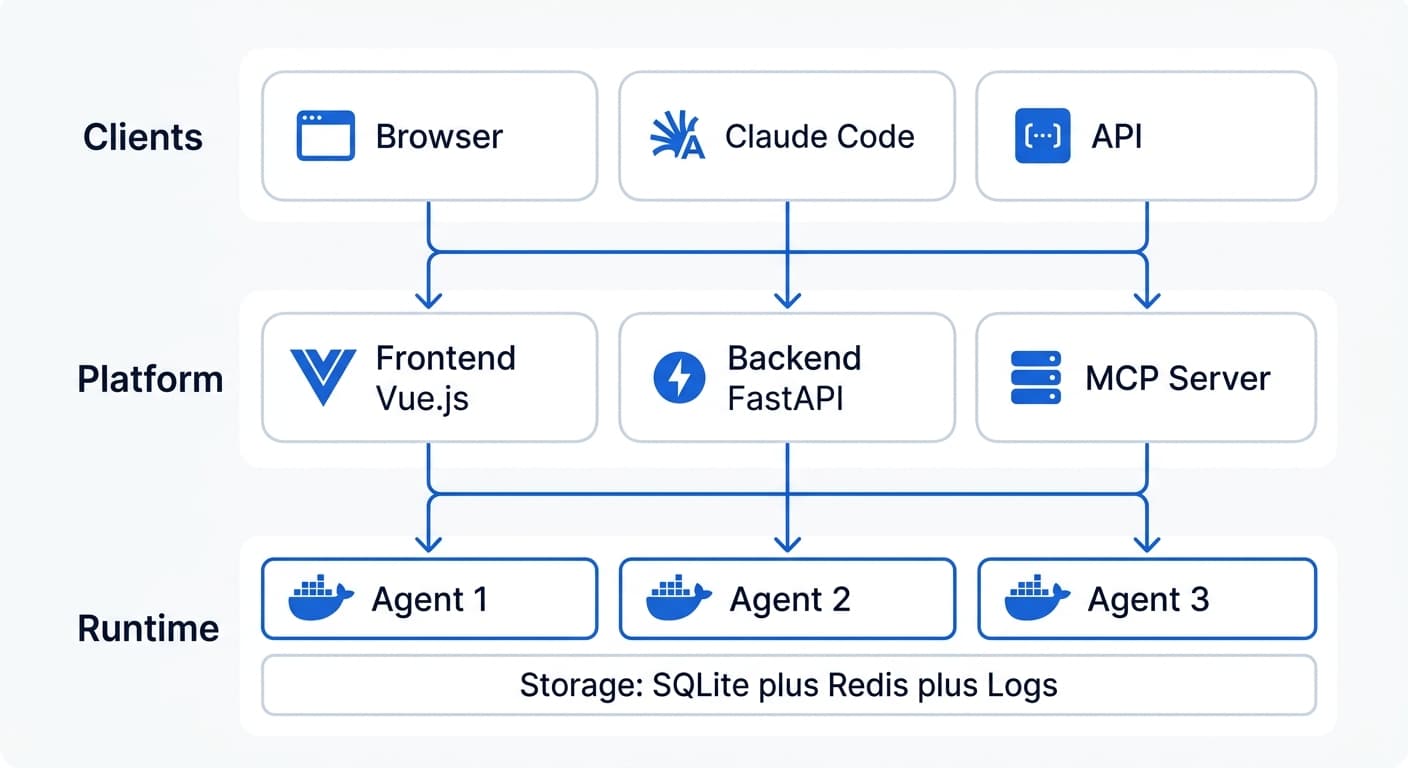
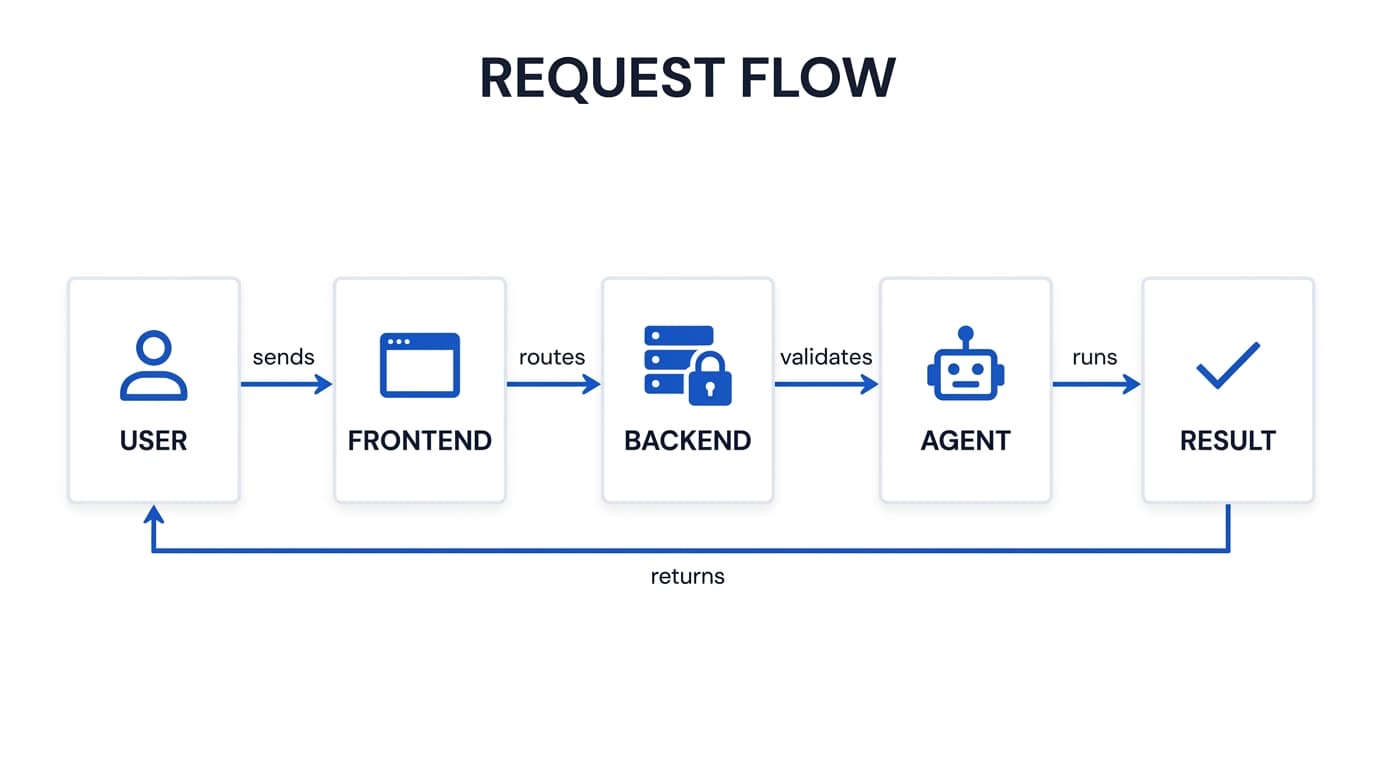
Architecture Diagram
Dashboard
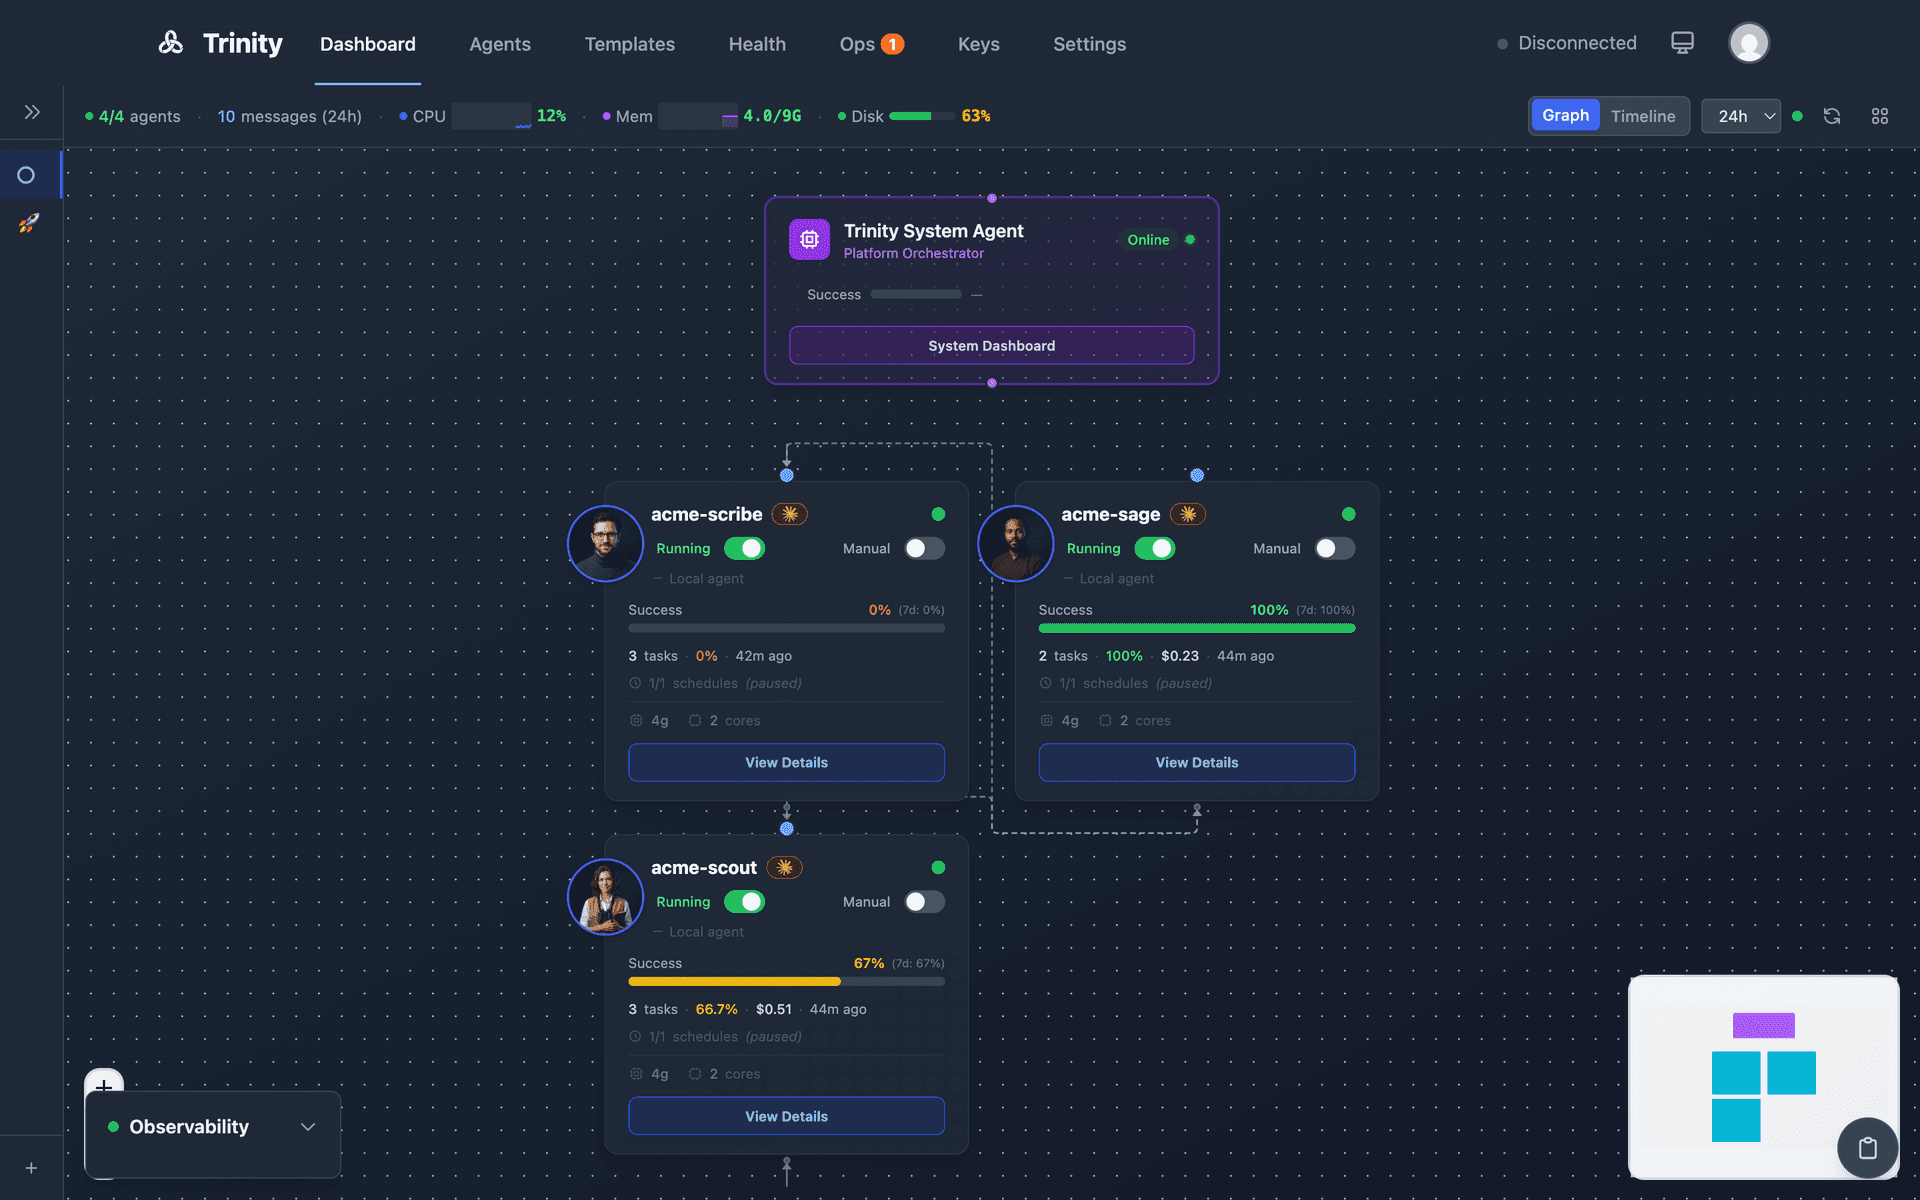
The main Dashboard provides a real-time agent network graph and timeline view for monitoring all agents and their activities.
Graph View (Default)
The default view shows all agents as draggable nodes in an interactive network graph built with Vue Flow.
- •Node colors indicate status: running (green), stopped (gray)
- •Animated edges appear when agents communicate (3-second animation)
- •Each node displays the agent name, avatar, success rate bar, and status indicator
- •Drag nodes to rearrange — positions persist in localStorage
- •Host telemetry (CPU/memory/disk) is displayed in the header
- •Capacity meter shows parallel execution slot usage
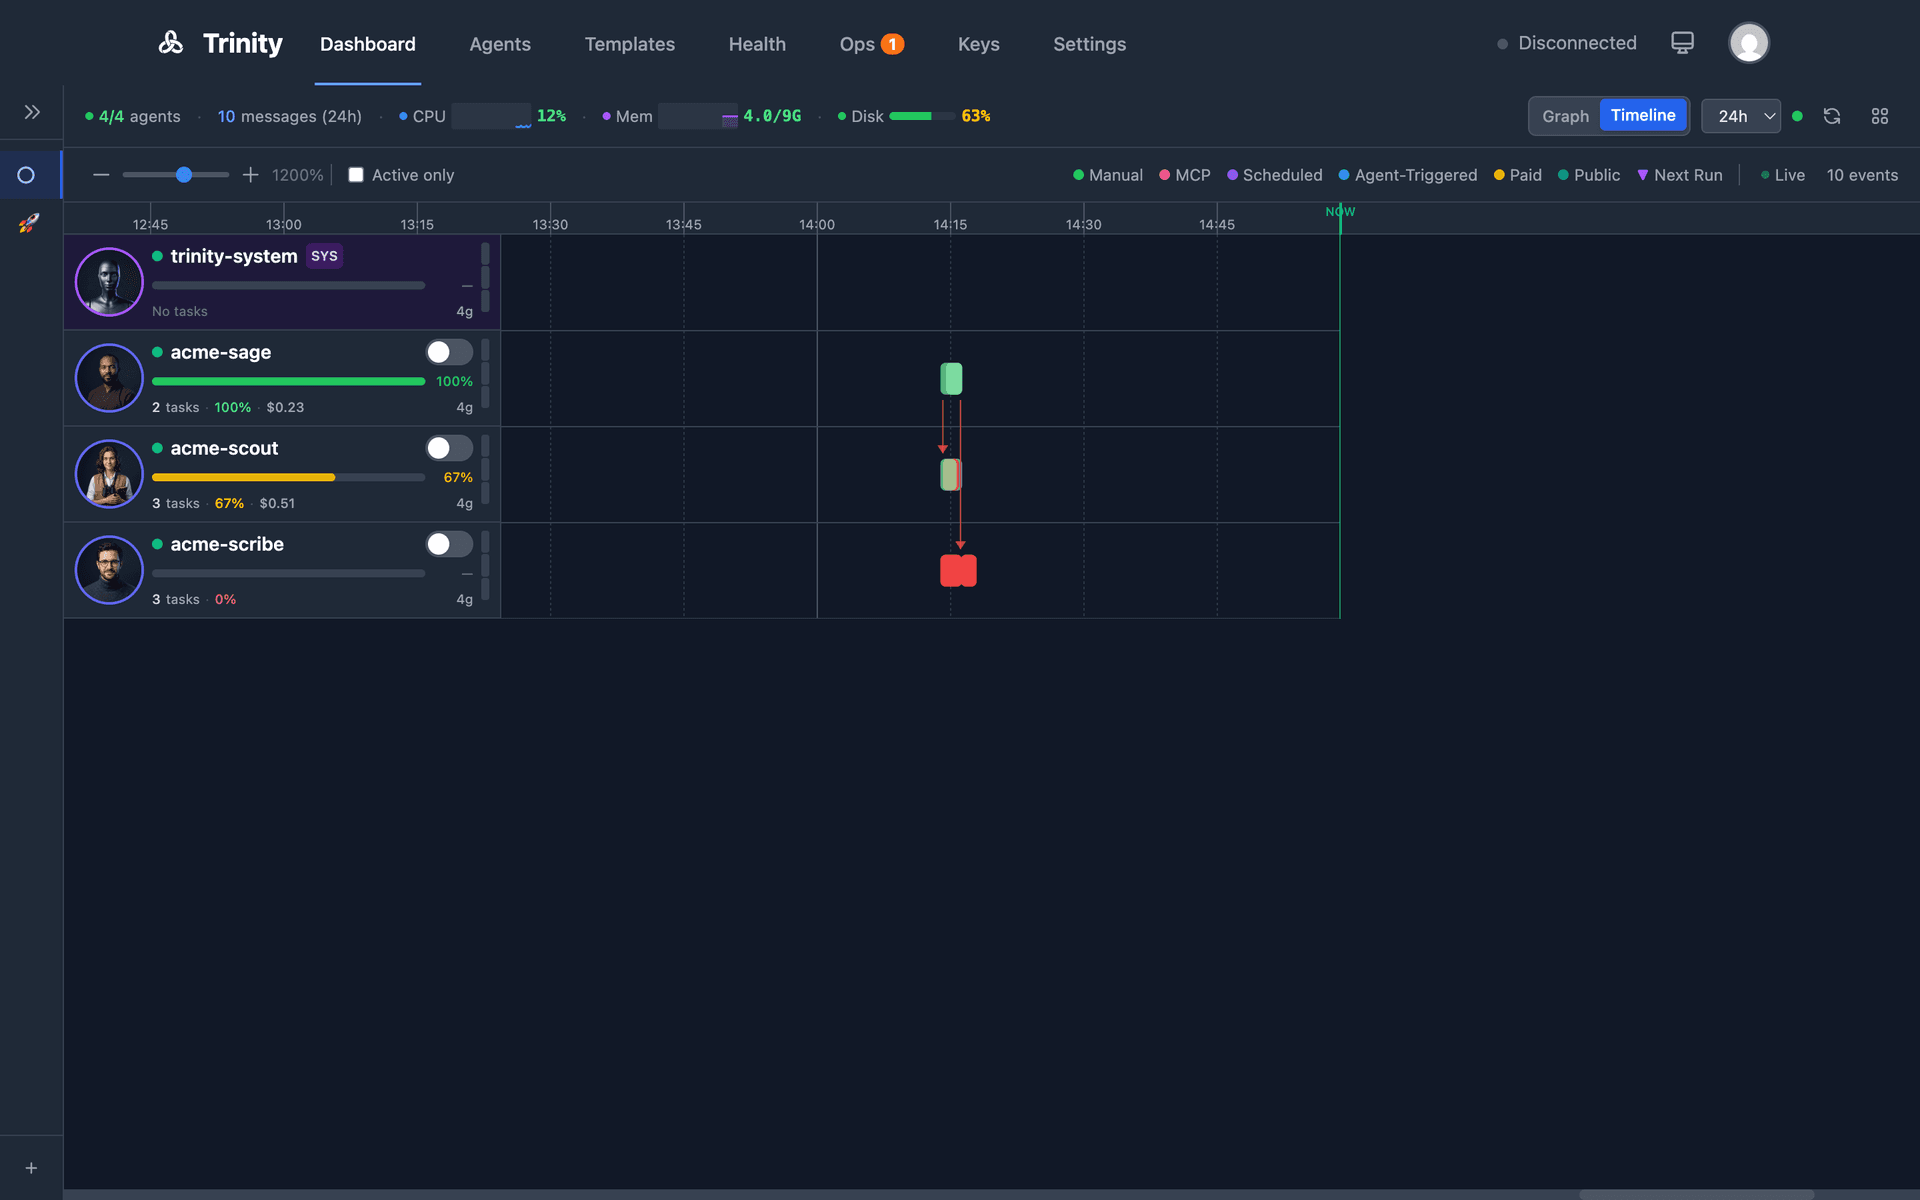
Timeline View
Toggle between Graph and Timeline via the mode switch. The timeline shows execution boxes per agent, arranged chronologically.
- •Color-coded by trigger type: manual (blue), schedule (purple), MCP (orange), chat (green)
- •Collaboration arrows connect related executions between agents
- •Live streaming: running executions show progress in real-time
- •Time range filter: 1h, 6h, 24h, 7d, or custom
- •Quick tag filters for focusing on specific agent groups
- •Filter persistence: time range and tag selections persist across sessions
Tag Clouds and Activity Feed
Agents are grouped visually by tags on the Dashboard. Click a tag cloud to filter the view to that group.
A real-time WebSocket-driven activity stream shows agent collaborations, task starts/completions, schedule executions, and errors as they happen.
Dashboard API Endpoints
| Endpoint | Method | Description |
|---|---|---|
/api/agents | GET | List all agents |
/api/agents/context-stats | GET | Context and activity state for all agents |
/api/agents/autonomy-status | GET | Autonomy status for all agents |
/api/activities/timeline | GET | Cross-agent activity timeline (filterable) |
/api/telemetry/host | GET | Host CPU/memory/disk |
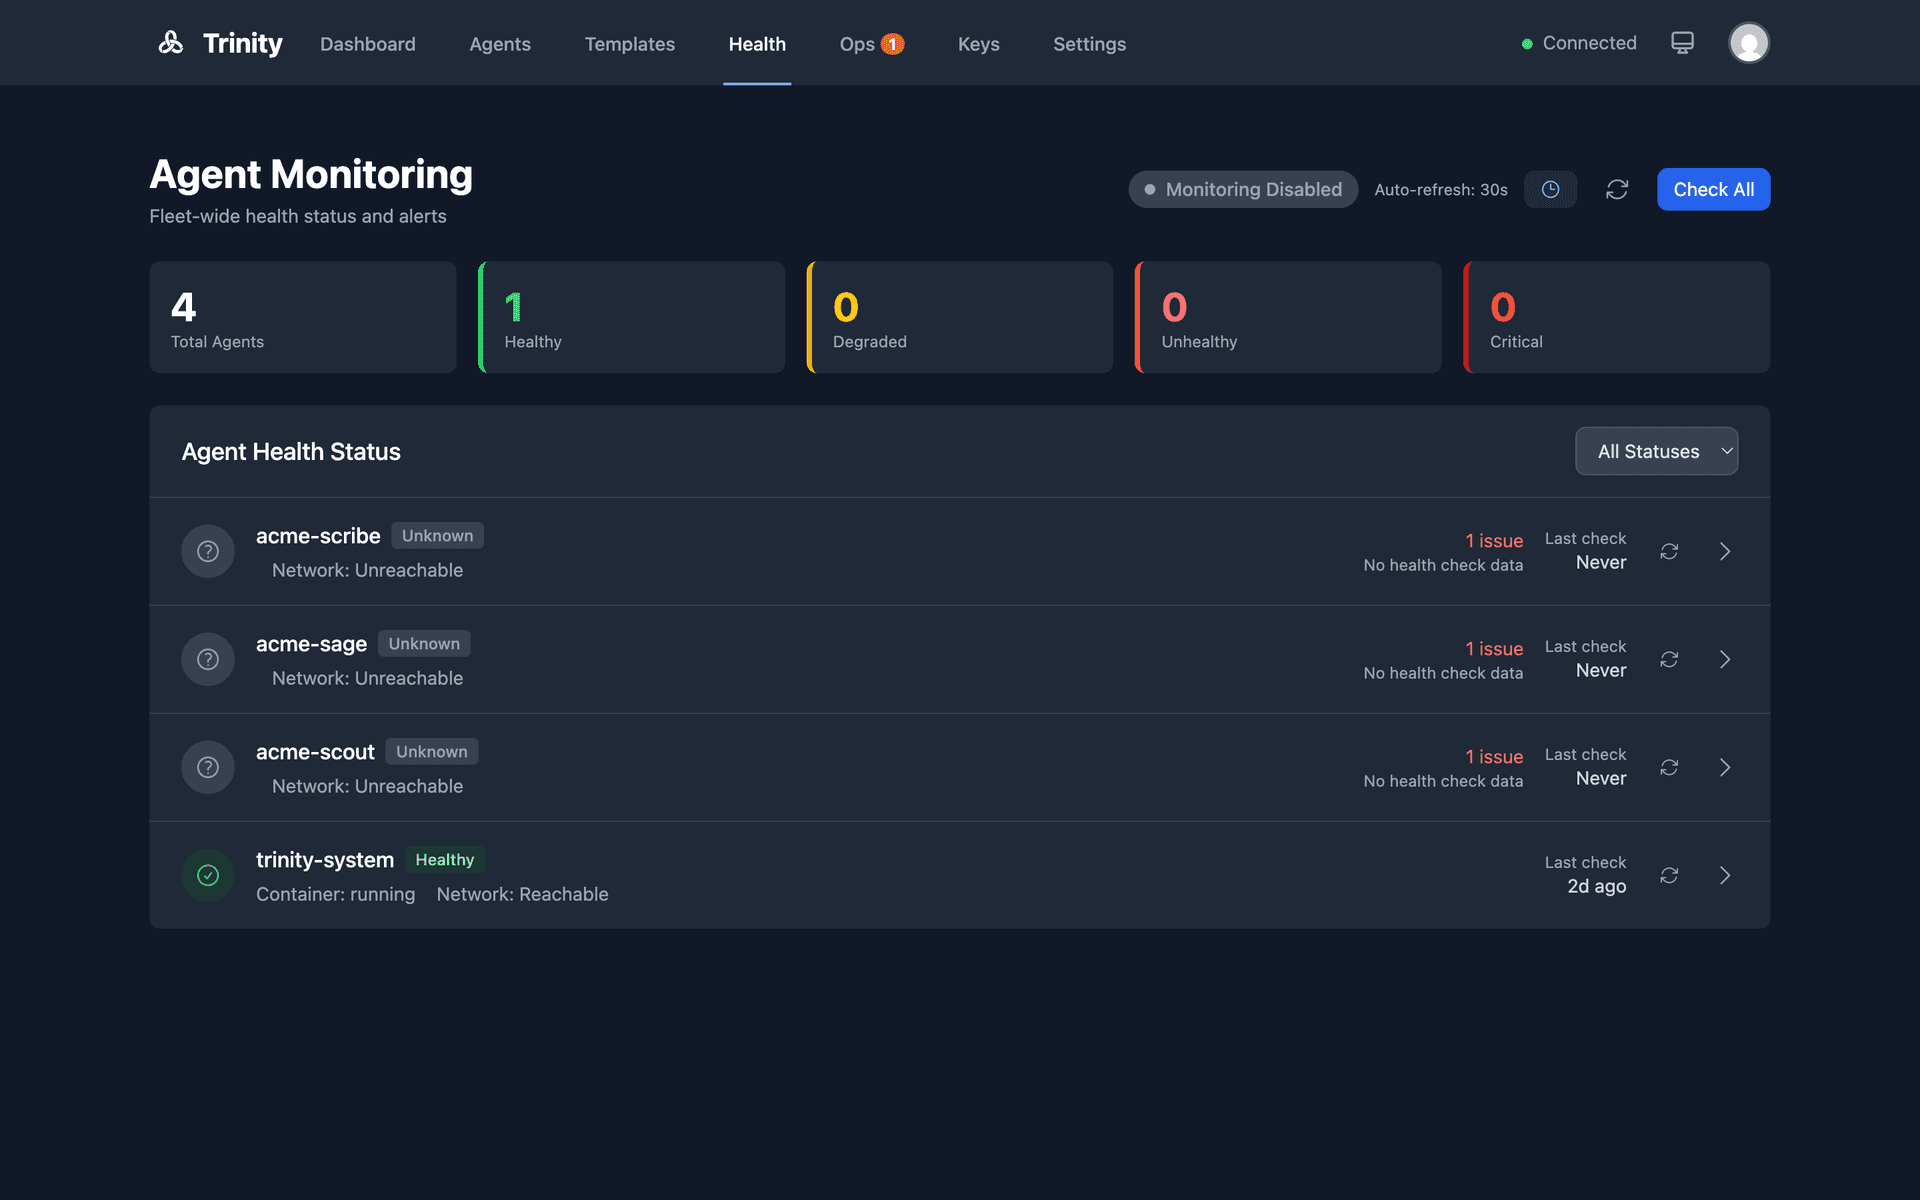
Monitoring
Multi-layer health monitoring for the agent fleet with real-time alerts, automatic cleanup of stuck resources, and a fleet-wide health dashboard.
Health Levels
Agent health is reported at five severity levels:
| Level | Meaning |
|---|---|
healthy | All checks passing |
degraded | Minor issues detected |
unhealthy | Significant problems |
critical | Immediate attention required |
unknown | Unable to determine status |
Three Monitoring Layers
Docker Layer — Container status, CPU/memory usage, restart count, OOM detection.
Network Layer — Agent HTTP reachability with latency tracking.
Business Layer — Runtime availability, context usage, error rates.
Alert Cooldowns: Repeated alerts for the same condition are throttled to prevent notification spam.
Fleet Health Dashboard
The fleet health dashboard is an admin-only view that summarizes the health of all agents in the system. Real-time WebSocket updates push health state changes as they occur. Individual agent health is visible in both the agent header and the Agents listing page.
Cleanup Service
A background service that automatically recovers stuck resources:
- •Stale executions — Any execution with
status='running'for longer than 120 minutes is markedfailed - •Stale activities — Any activity with
activity_state='started'for longer than 120 minutes is markedfailed - •Stale Redis slots — Orphaned slot reservations are released
- •Run frequency — Every 5 minutes, plus a one-shot sweep on backend restart
- •Startup recovery — Orphaned executions (container down, not in process registry) are marked
failedimmediately and their slots are released
Monitoring MCP Tools
| Tool | Description |
|---|---|
get_fleet_health() | Fleet-wide health summary |
get_agent_health(name) | Individual agent health |
trigger_health_check() | Force an immediate health check |
Monitoring API Endpoints
| Endpoint | Method | Description |
|---|---|---|
/api/monitoring/fleet-health | GET | Fleet health summary |
/api/monitoring/cleanup-status | GET | Cleanup service status (admin) |
/api/monitoring/cleanup-trigger | POST | Force a cleanup run (admin) |
Operating Room
Unified operator command center with four tabs — Queue, Notifications, Cost Alerts, and System — providing real-time visibility into agent operations that require human attention.
Queue Tab
Shows items from agents' operator queues: questions, approval requests, and status updates.
- •Agents write to
~/.trinity/operator-queue.jsoninside their container - •A background sync service polls running agents every 5 seconds and persists items to the backend database
- •Operators can respond to items directly; responses are written back to the originating agent
- •Filter by status, type, priority, or agent name
- •WebSocket events:
operator_queue_new,operator_queue_responded,operator_queue_acknowledged
Notifications Tab
Consolidated view of agent notifications.
- •Filter by status, priority, agent, or type
- •Stats cards display counts by status
- •Bulk selection and bulk actions
- •Real-time updates via WebSocket
Cost Alerts Tab
Cost threshold monitoring and alerting. Configure cost thresholds per agent or globally.
System Tab
System-level information and controls.
Sync Service
Restart-resilient sync between agent containers and the backend database. Manual refresh button available. Stale prompt detection flags items older than expected.
Operating Room API
| Endpoint | Method | Description |
|---|---|---|
/api/operator-queue | GET | List queue items |
/api/operator-queue/stats | GET | Queue statistics |
/api/operator-queue/{id} | GET | Get single item |
/api/operator-queue/{id}/respond | POST | Submit response |
/api/operator-queue/{id}/cancel | POST | Cancel item |
/api/operator-queue/agents/{name} | GET | Items for a specific agent |
MCP Tool: send_notification(agent_name, message, priority) — sends a notification to the Operating Room from within an agent.
Infrastructure Components
Backend (FastAPI)
:8000Python 3.11, FastAPI, Uvicorn
Central orchestrator with 40+ routers covering agents, chat, schedules, credentials, skills, processes, monitoring, and more. Manages agent containers via the Docker socket (mounted read-only). Broadcasts real-time events over WebSocket.
Frontend (Vue.js 3)
:80Vue.js 3, Tailwind CSS, Vite, Nginx
Single-page web dashboard for managing agents, viewing activity streams, monitoring schedules, and interacting with agents via chat. Connects to the backend API and WebSocket for live updates.
MCP Server
:8080Node.js, TypeScript, SSE transport
Model Context Protocol server exposing 74 tools for agent management, chat, schedules, skills, systems, tags, notifications, and monitoring. Enables Claude Code and other MCP clients to control Trinity programmatically.
Scheduler Service
:8001Python, APScheduler, Redis distributed locks
Dedicated single-instance service for cron-based agent task execution. Uses Redis distributed locking to prevent duplicate runs. Syncs schedules from the SQLite database and dispatches tasks to agents via the backend API.
Redis
:6379Redis 7 Alpine, AOF persistence
Stores encrypted credentials, distributed locks for the scheduler, execution queue state, and pub/sub events. Supports optional password authentication for production deployments.
SQLite
:N/ASQLite 3, /data/trinity.db
Primary data store for agents, users, schedules, activities, permissions, skills, tags, chat sessions, audit logs, and execution history. Stored on the trinity-data volume shared between backend and scheduler.
Vector (Log Aggregation)
:8686Timber Vector 0.43, Docker log source
Collects logs from all containers via the Docker socket. Writes structured NDJSON to the trinity-logs volume. The backend reads these logs for the activity stream and log viewer in the dashboard.
OTel Collector (Optional)
:4317 / 8889OpenTelemetry Collector Contrib 0.120
Receives OTLP metrics and traces from Claude Code agents running inside containers. Exports metrics in Prometheus format on port 8889. Enabled by setting OTEL_ENABLED=1.
Data Flow
A typical request flows through the system as follows:
Authentication — JWT tokens for browser sessions, MCP API keys for programmatic access. WebSocket connections require token authentication.
Execution Queue — Each agent processes one request at a time. Additional requests queue (up to 3). The slot service tracks capacity for the dashboard meter.
Agent Execution— The backend proxies chat to the agent's internal web server (running inside the container). Claude Code or Gemini CLI processes the request with full tool access.
Real-time Updates — Events broadcast over WebSocket to the dashboard and filtered to MCP clients based on agent access permissions.
Network Topology
All services run on a single Docker bridge network (trinity-agent-network, subnet 172.28.0.0/16). Agent containers are dynamically attached to this network when created.
Exposed Ports (Host)
| Port | Service | Notes |
|---|---|---|
| 80 | Frontend (Nginx) | Configurable via FRONTEND_PORT |
| 8000 | Backend (FastAPI) | REST API + WebSocket |
| 8080 | MCP Server | SSE transport, API key auth |
| 8001 | Scheduler | Health check endpoint only |
| 6379 | Redis | Optional password auth |
| 8686 | Vector | Health/API endpoint |
| 4317 | OTel Collector | gRPC OTLP receiver (optional) |
| 8889 | OTel Collector | Prometheus exporter (optional) |
| 2222+ | Agent SSH | Auto-assigned, one per agent |
Internal Communication
Services reference each other by container name on the Docker network. The MCP server reaches the backend at http://backend:8000. The scheduler connects to Redis at redis://redis:6379. Agent containers communicate with the backend using the internal API secret for authentication.
Storage
| Volume | Purpose | Mounted In |
|---|---|---|
| trinity-data | SQLite DB, archives | Backend, Scheduler |
| redis-data | Redis AOF persistence | Redis |
| trinity-logs | Vector NDJSON logs | Vector, Backend (ro) |
| trinity-archives | Compressed log archives | Backend |
| agent-configs | Agent configuration | Backend |
| agent-{name}-workspace | Per-agent persistent FS | Agent container |
SQLite (/data/trinity.db) stores all platform state: users, agents, permissions, schedules, activities, chat sessions, audit logs, skills, tags, and execution history.
Redis stores encrypted credentials, distributed scheduler locks, execution queue state, and pub/sub events. Configured with AOF persistence.
Agent Workspaces — Each agent gets a dedicated Docker volume (agent-{name}-workspace) mounted at /home/developer. This volume persists across container restarts and contains the agent's code, configuration, CLAUDE.md, and working files.
Host Mounts — The Docker socket is mounted read-only into the backend for container management. Agent templates, process templates, hooks, and process docs are mounted read-only from the host config directory.
Security Posture
All platform containers run with no-new-privileges and drop all Linux capabilities except what is required. The backend uses a tmpfs for /tmp with noexec. Agent containers can optionally run in restricted mode (default) or full-capabilities mode for packages that require apt-get.