Managing Agents
Control the lifecycle, health, and resources of your Trinity agents through the UI, API, or MCP tools.
The Agent Detail Page
Click any agent to open its detail page. The page lands on the Overview tab and organizes everything else into tabs:
| Tab | ?tab= | Purpose |
|---|---|---|
| Overview | overview | Default landing tab — trends, health, recent activity (see below) |
| Tasks | tasks | Headless task execution and history |
| Chat | chat | Stateless conversation — see Agent Chat |
| Dashboard | dashboard | The agent's own dashboard — only when it ships a dashboard.yaml |
| Brain | brain | Knowledge-graph page — only for agents that declare the capability |
| Reports | reports | Structured results the agent published — see Agent Reports |
| Canvas | canvas | The surface the agent keeps current — see Agent Canvas |
| Schedules | schedules | Cron-based automation — see Scheduling |
| Loops | loops | Sequential bounded task runs — see Agent Loops |
| Playbooks | playbooks | Reusable command templates |
| Credentials | credentials | Credential injection and export |
| Payments | nevermined | Paid access configuration |
| Access | access | Operator access roster (owners only) |
| Sharing | sharing | External clients and channels (owners only) |
| Permissions | permissions | Which agents may call this one (owners only) |
| A2A | a2a | External-orchestrator interoperability (owners only, where available) |
| Git | git | Git sync controls — only for GitHub-synced agents |
| Files | files | Workspace file browser |
| Folders | folders | Shared folder configuration (owners only) |
| Skills | skills | Assign skills from the library (owners only) — see Skills |
| Settings | settings | Per-agent configuration (owners only) — see Agent Configuration |
| Info | info | Template metadata and capabilities |
Tabs marked owners only are hidden from users an agent is merely shared with, and are never shown on the system agent. Dashboard, Brain, Git, and A2A appear only when that agent or instance supports them.
Every visible tab is deep-linkable with ?tab= — including the conditional ones. A ?tab= value naming a tab you cannot see falls back to Overview. Two legacy links still resolve: ?tab=guardrails opens Settings, and ?tab=session redirects to that agent's Workspace conversation.
When the window is too narrow to fit every tab, the trailing tabs collapse into a More ▾ menu at the end of the tab strip. If the active tab is inside the menu, the More button carries the active highlight. Deep links via ?tab= work either way.
Overview Tab
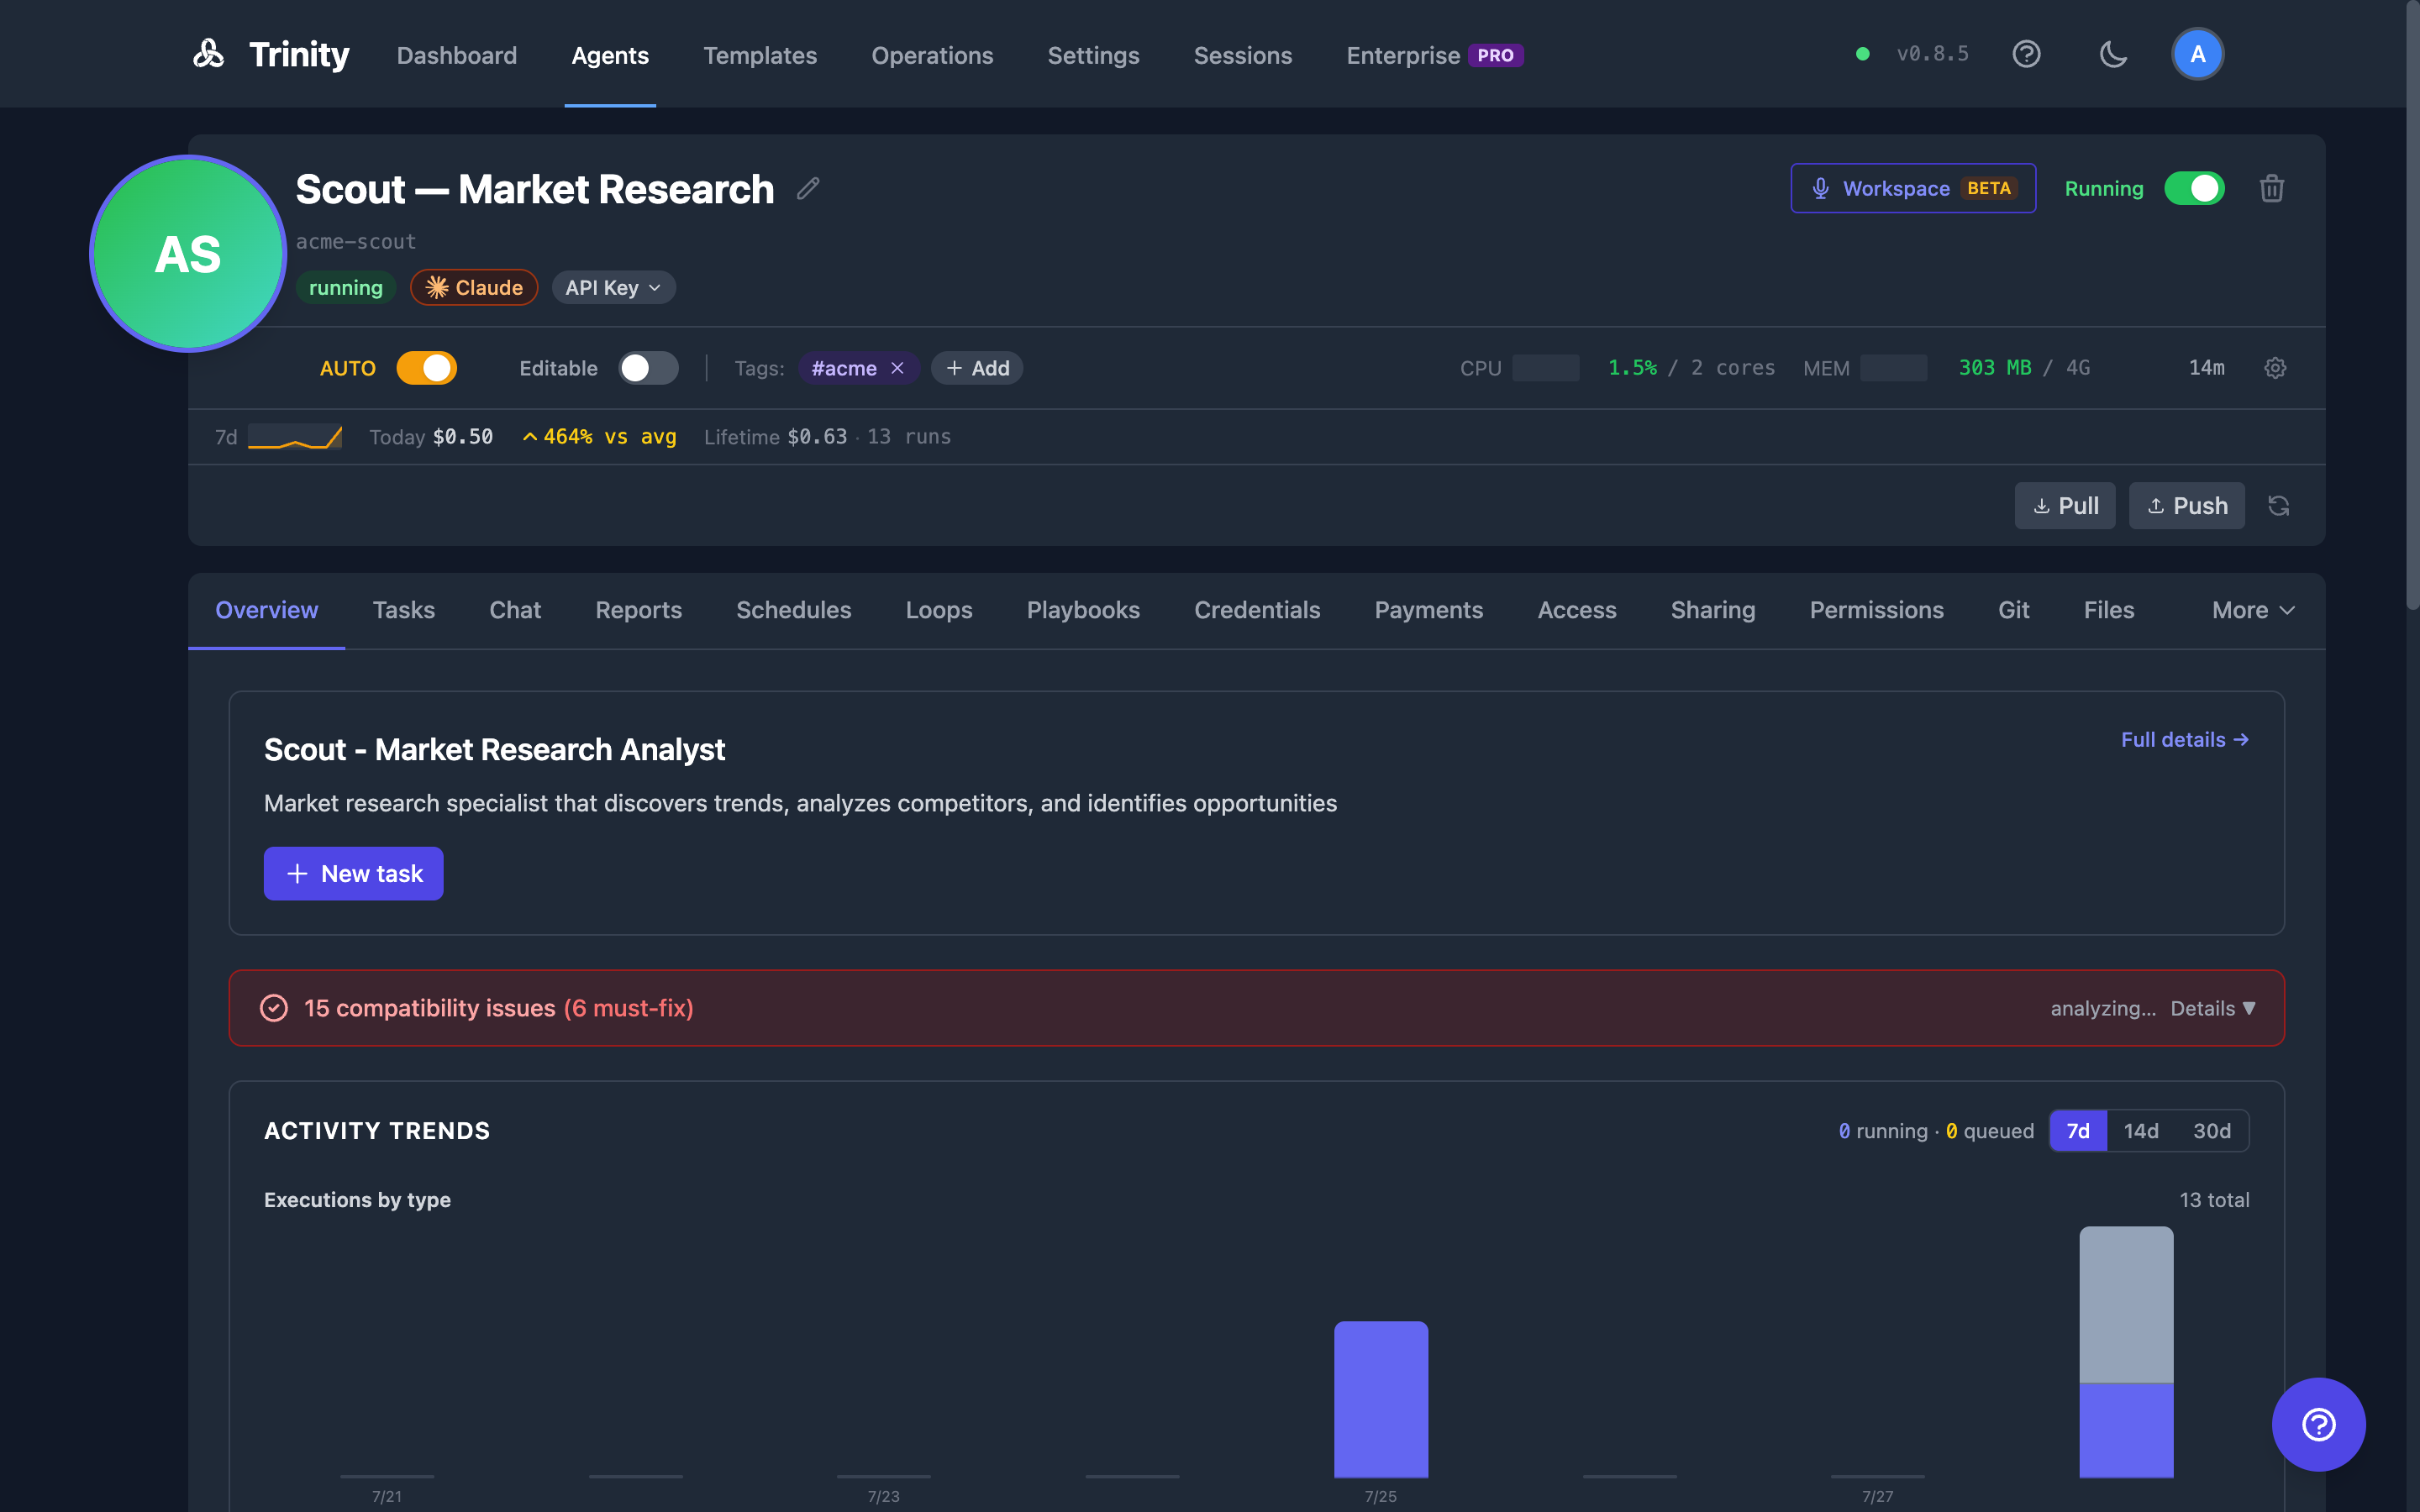
The Overview tab is a glanceable, database-backed summary. It renders even when the agent is stopped:
The persistent header above the tabs still owns live “now” state: status, CPU/memory gauges, cost, and quick controls. The Overview shows trends; the header shows the present. Two of its buttons are doors into other surfaces:
GET /api/agents/{name}/analytics?window=7d|14d|30dStart and Stop
Toggle an agent between Running and Stopped using the switch on a Dashboard tile or list row, or in the Agent Detail header. A loading spinner displays during state transitions.
POST /api/agents/{name}/start and POST /api/agents/{name}/stopstart_agent(name) and stop_agent(name)After a host reboot. Agent containers are created with Docker's unless-stopped restart policy, so when the host reboots or the Docker daemon restarts, every agent that was running comes back on its own — schedules resume without anyone starting agents by hand. An agent you deliberately stopped stays stopped: the policy honours Docker's manual-stop flag, so a quarantined agent is never resurrected by a reboot. While Docker is bringing agents back they may briefly show as stopped. The policy is set when the container is created; agents created before this behaviour shipped adopt it on their next recreate (a resource, runtime, or base-image change), not on a plain restart — an upgrading install can sweep its existing fleet once using the AGENT_RESTART_POLICY_2026-09.md migration note in the Trinity repository.
Display Label
The display label is the friendly name shown across the UI — the header, agent pickers, search, sort, and the activity timeline. Editing it is the everyday “rename”: it changes what people read without moving the immutable slug (name), so it never breaks URLs, MCP tool names, schedules, or webhooks. For most day-to-day relabeling, this is the change you want; the heavier Rename below moves the slug itself.
rename_agent tool moves the slug, not the label.)GET /api/agents/{name}/label and PUT /api/agents/{name}/label with body {"label": "My Agent"} (send {"label": null} or an empty string to clear back to the slug)Rename
Renaming moves the immutable slug itself — the heavier operation. Because the slug is what URLs, MCP tool names, schedules, and webhooks resolve to, prefer the Display Label above when you only need to change the friendly name.
Click the pencil icon next to the agent name on the Agent Detail page to edit inline. Renaming is atomic: it updates the database, renames the Docker container, and broadcasts the change via WebSocket.
Restrictions: system agents cannot be renamed. Only owners and admins have permission to rename.
PUT /api/agents/{name}/rename with body {"new_name": "new-name"}rename_agent(name, new_name)Delete
Use the Delete button on the Agent Detail page. A confirmation dialog is required. Deletion cleans up the container, network, sharing records, schedules, activities, and event subscriptions.
DELETE /api/agents/{name}delete_agent(name)Health and Status
The agent header displays status (Running/Stopped), CPU and memory usage, network I/O, and uptime. Telemetry auto-refreshes every 10 seconds.
Fleet-wide monitoring is available at GET /api/monitoring/fleet-health. Health levels, from best to worst: healthy, degraded, unhealthy, critical, unknown.
get_agent_health(name), get_fleet_health(), trigger_health_check()Resource Allocation
Configure per-agent memory and CPU limits from the agent header: click the gear button (“Configure resources”) to open the resource modal. Limits are enforced at the container level and take effect on the next restart — see Agent Configuration for valid values and fleet-wide defaults.
Execution timeout is configurable per agent (range: 60–7200 seconds, default: 3600 seconds / 60 minutes).
The agent's timeout is the ceiling for any of its schedules — setting it below an active schedule's timeout_seconds is rejected with 400 error=agent_timeout_below_active_schedules.
GET /api/agents/{name}/timeout and PUT /api/agents/{name}/timeoutListing
The Dashboard lists the fleet in three modes — Timeline, Grid, and List (press v to cycle them). List mode is the row view with success-rate bars; filter by name, status, or tags. The old /agents page redirects to the Dashboard's List mode. See Dashboard.
GET /api/agents returns all agentslist_agents()For Agents
Agents can manage other agents programmatically through the MCP tools listed above. Common patterns include orchestrator agents that start and stop worker agents on demand, or monitoring agents that poll fleet health and trigger alerts when agents become degraded or unhealthy.