Dashboard
The main Dashboard at / provides a real-time agent network graph and timeline view for monitoring all agents and their activities.
Graph View (Default)
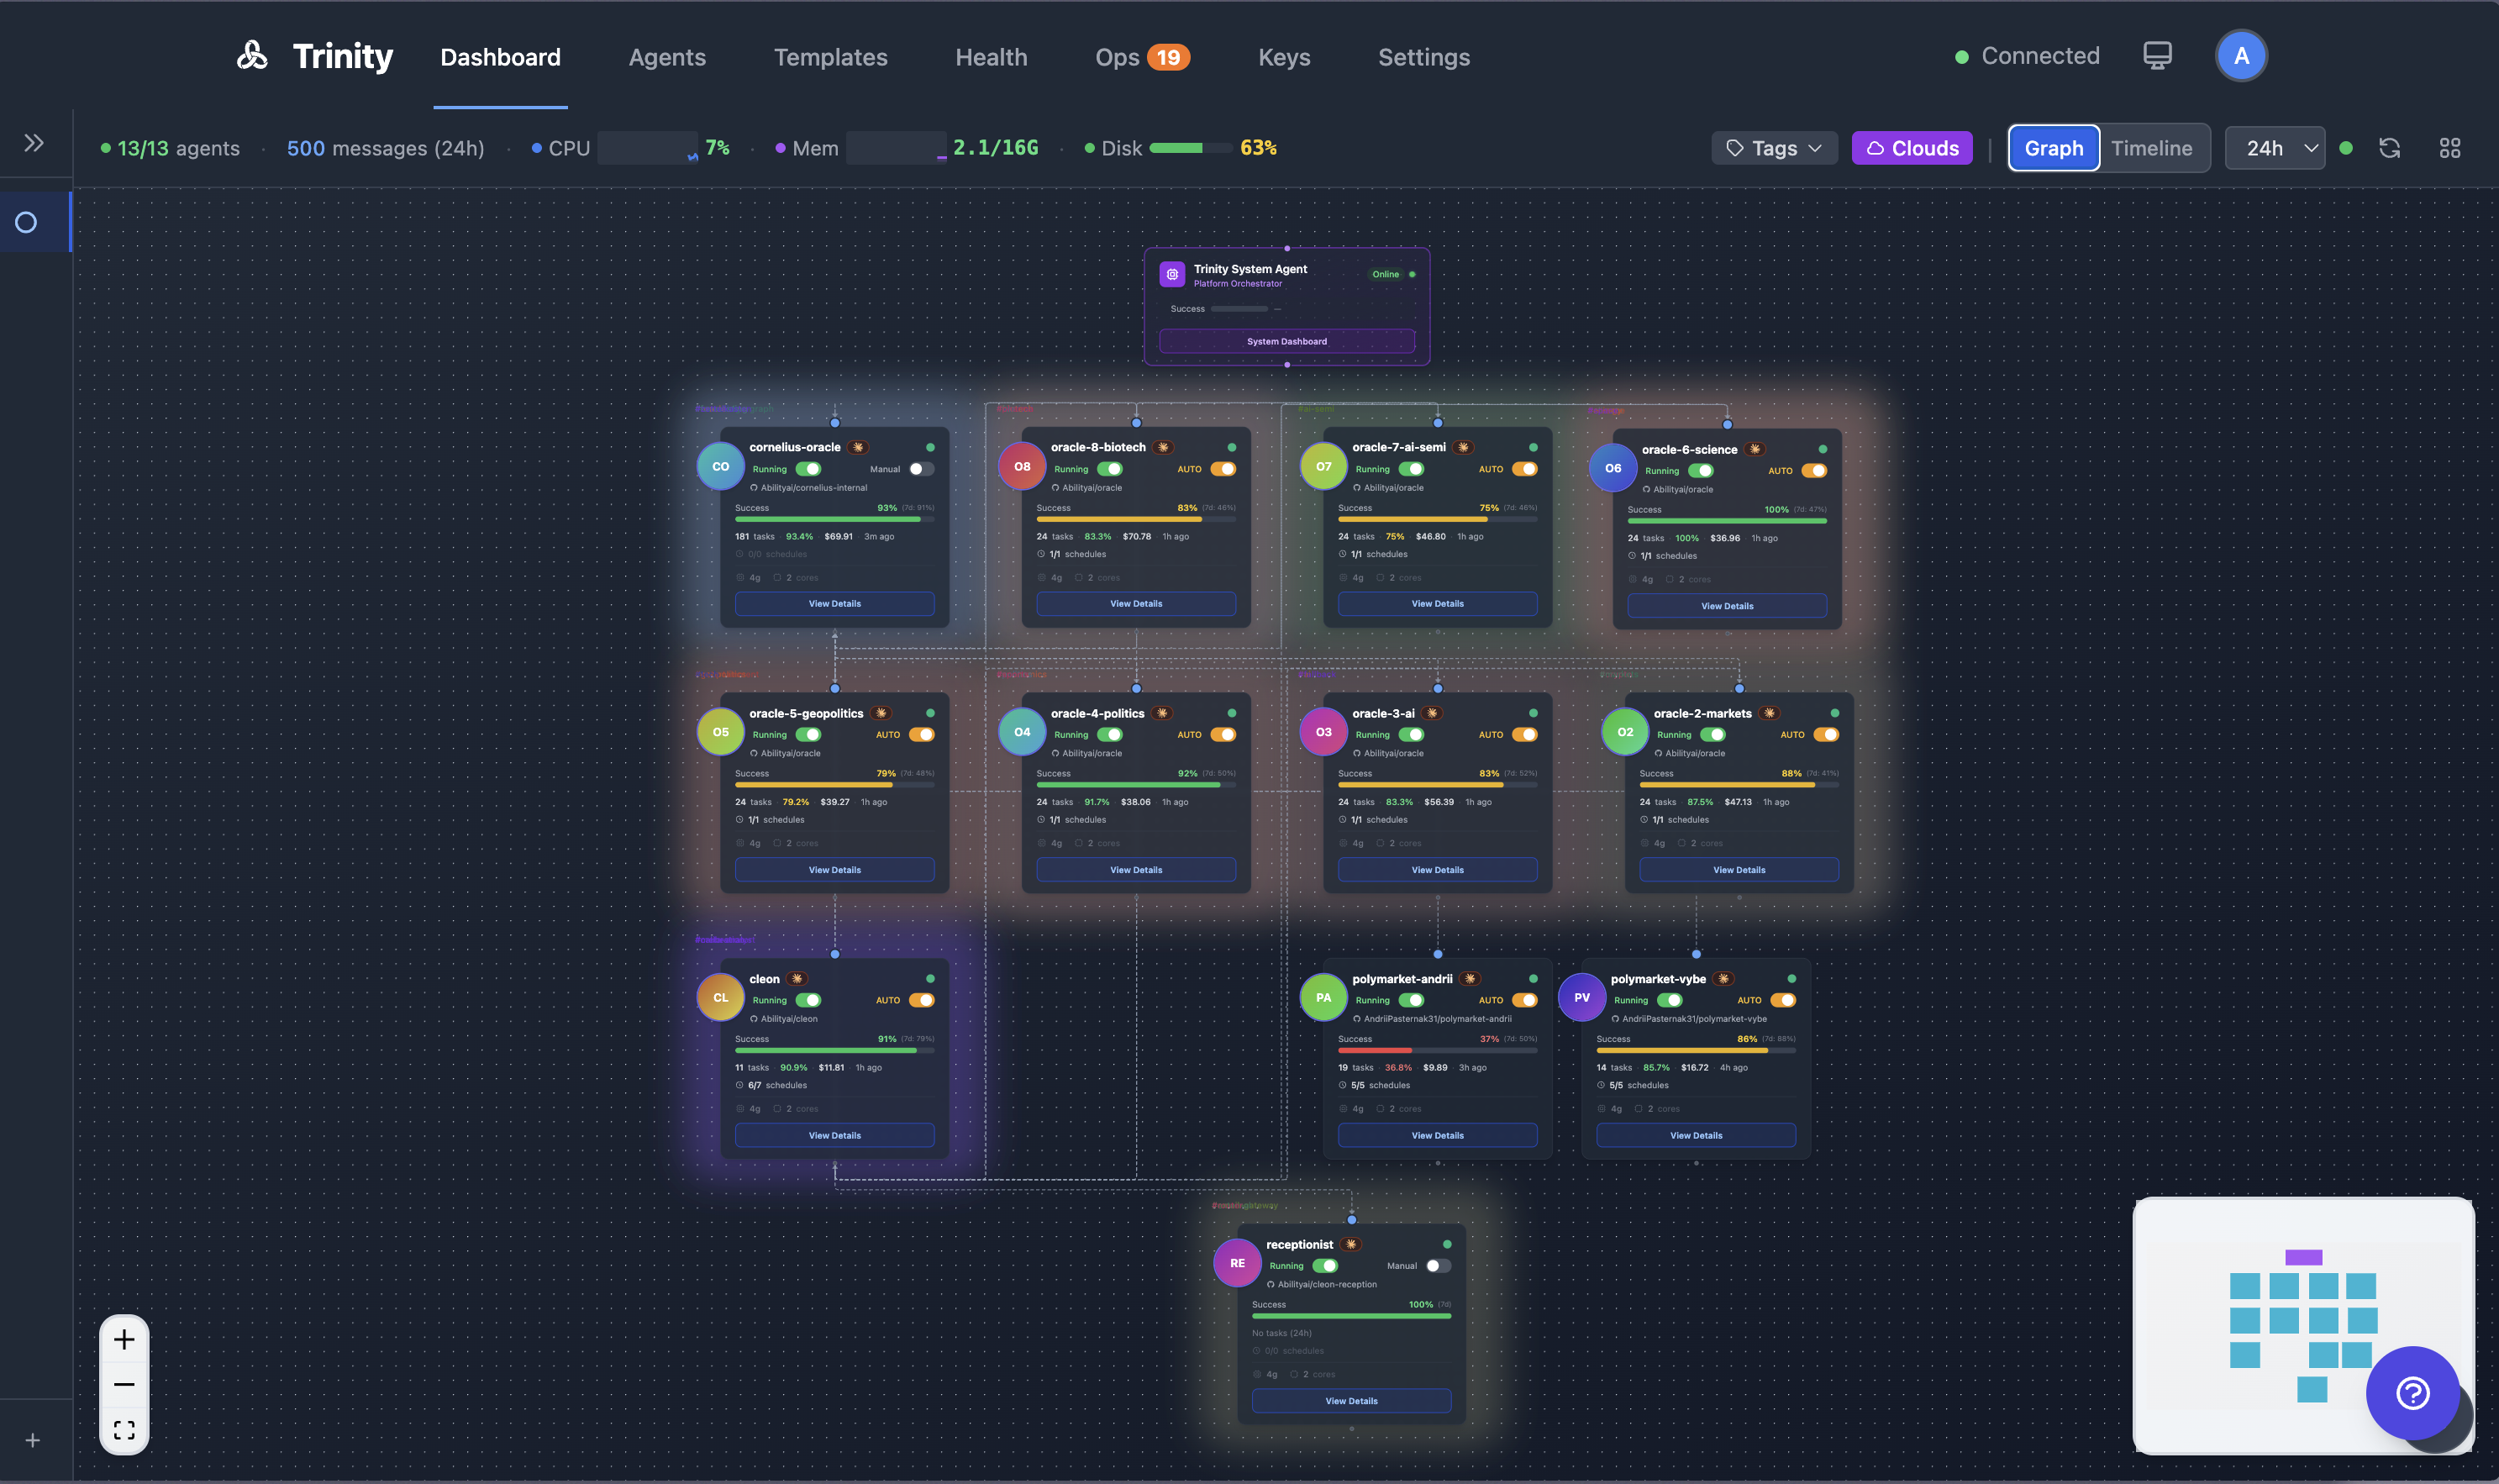
Shows all agents as draggable nodes in a network graph (Vue Flow).
Node colors indicate status: running (green), stopped (gray).
Animated edges appear when agents communicate (3-second animation).
Each node displays the agent name, avatar, success rate bar, and status indicator.
Drag nodes to rearrange — positions persist in localStorage.
Host telemetry (CPU/memory/disk) is displayed in the header.
Capacity meter shows parallel execution slot usage.
Timeline View
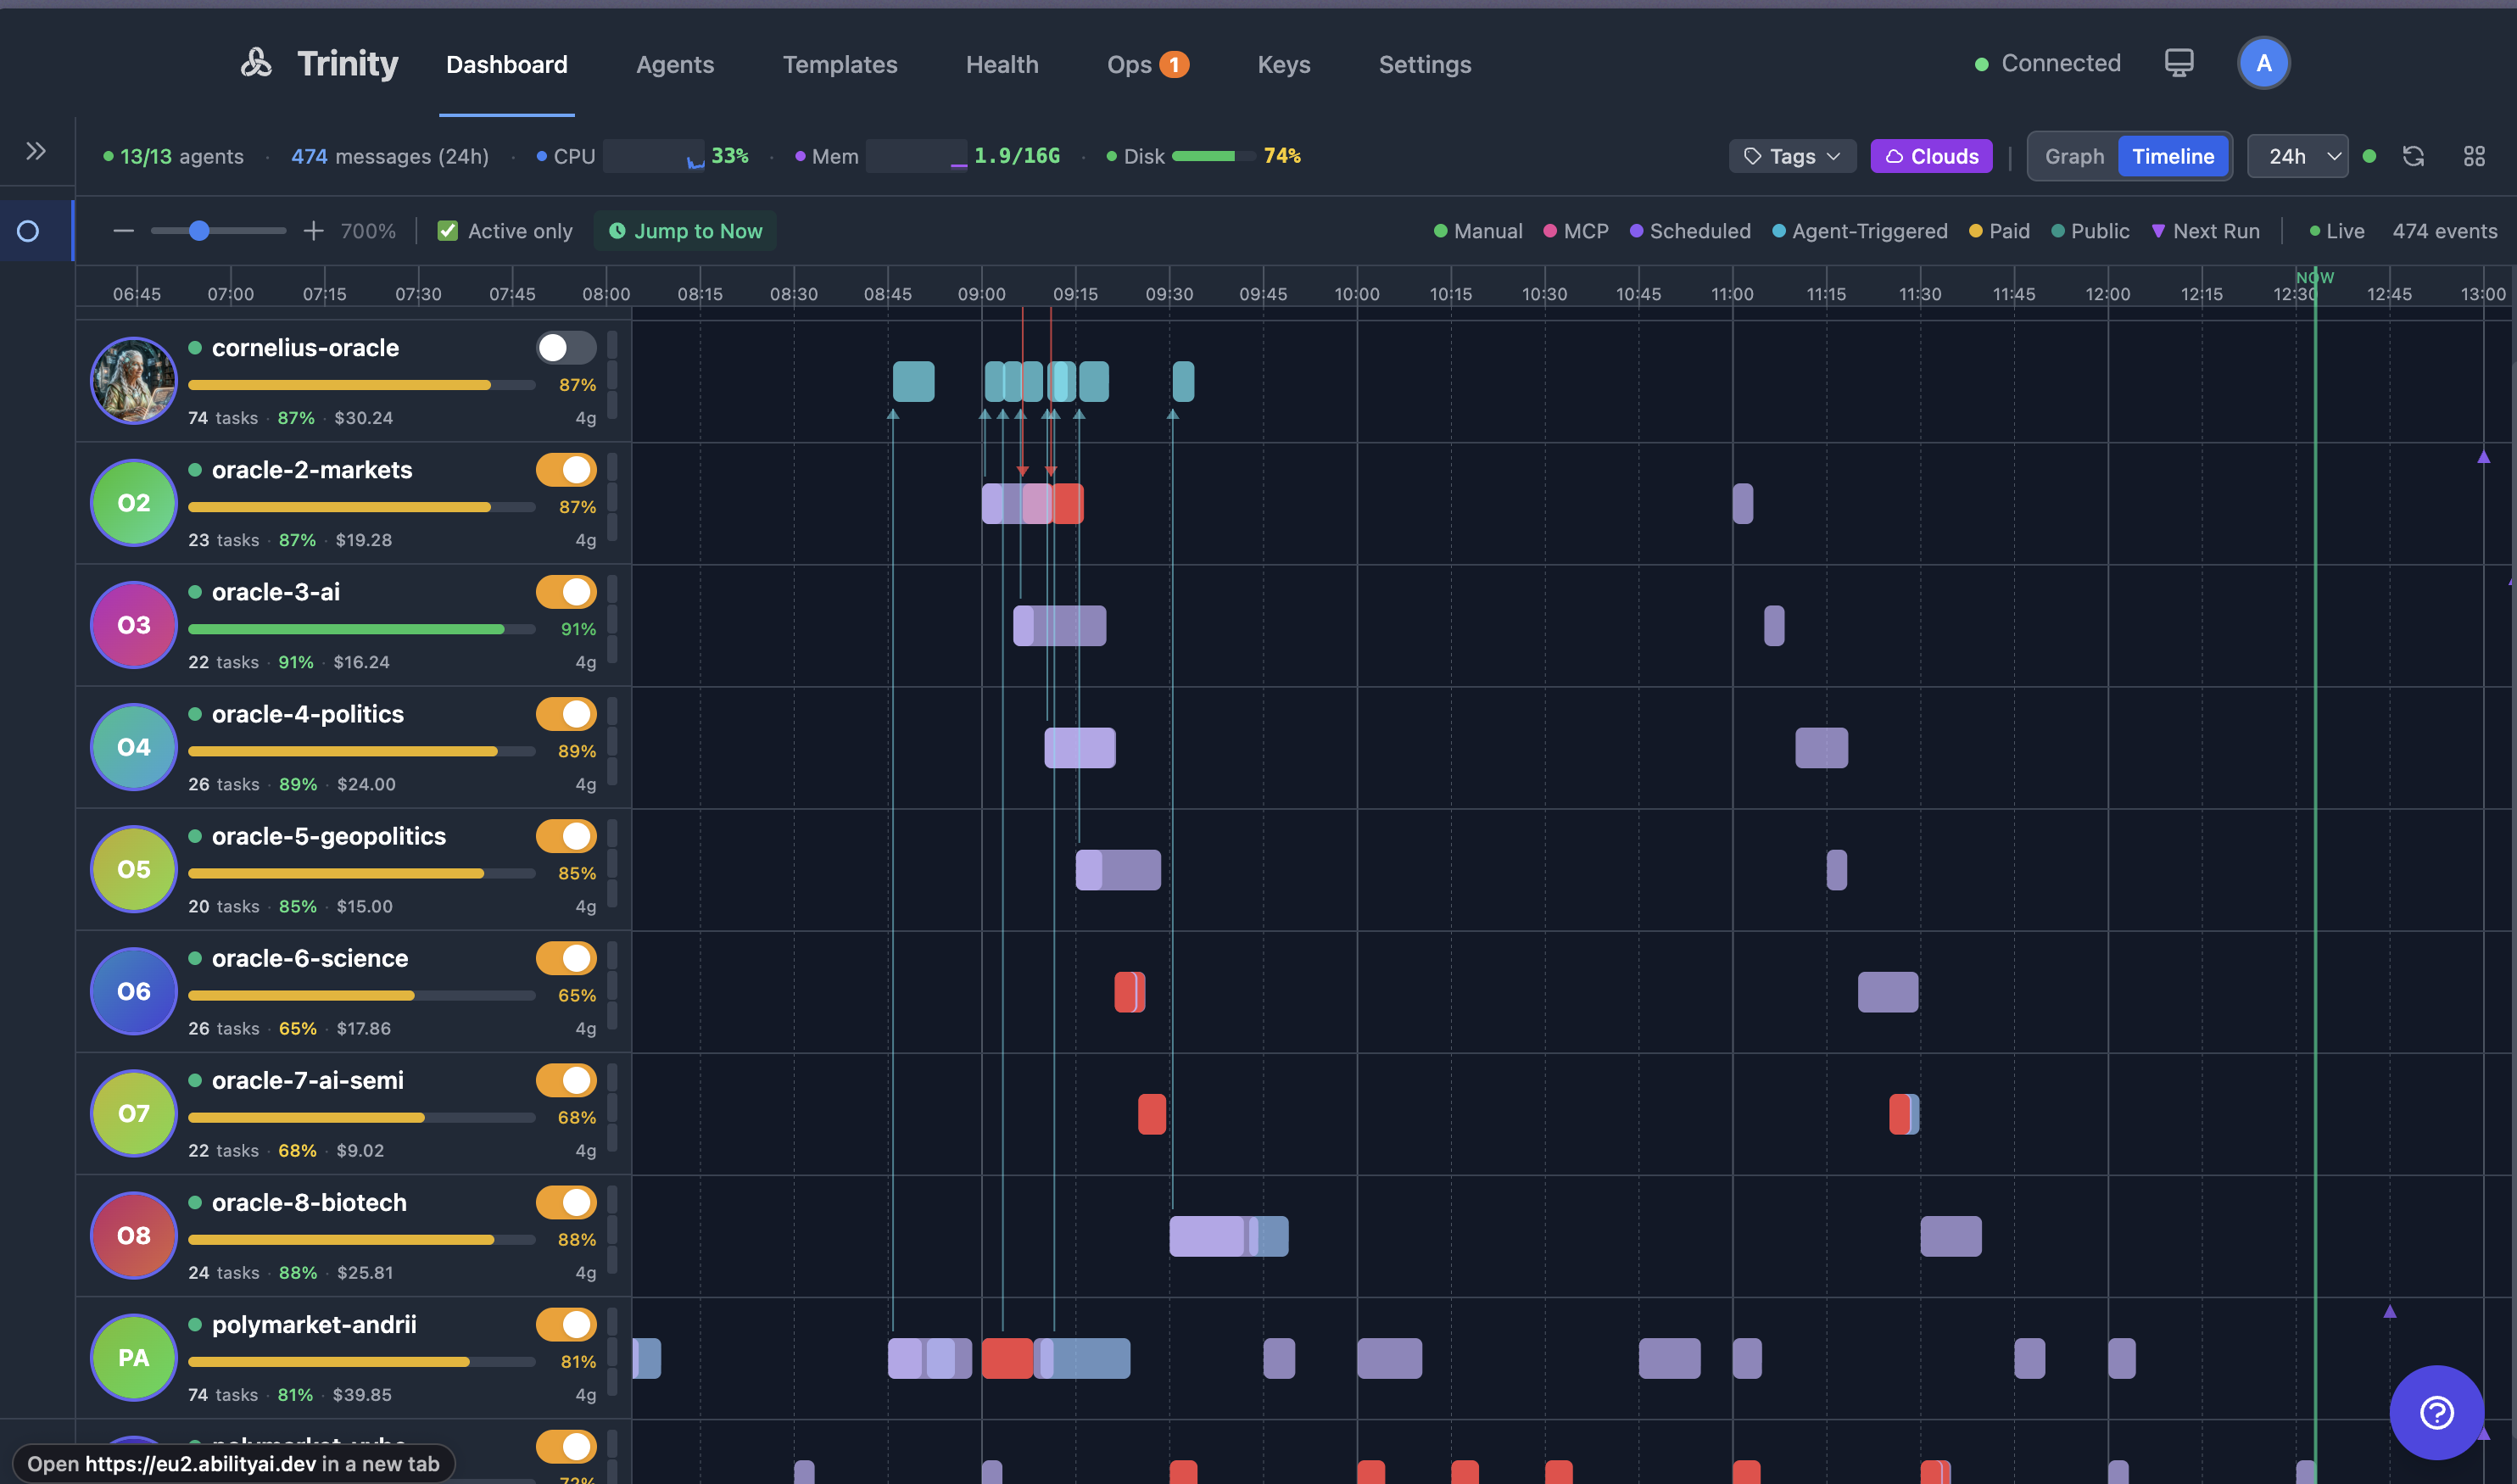
Toggle between Graph and Timeline via the mode switch in the top-right.
Timeline shows execution boxes per agent, arranged chronologically.
Color-coded by trigger type: Manual (green), MCP (teal), Scheduled (purple), Agent-Triggered (blue), Paid (yellow), Public (white).
Each row shows the agent's success rate, total cost, and parallel slot count.
Live streaming: running executions show progress in real-time with a "Live" indicator.
Time range filter: 1h, 6h, 24h, 7d, or custom.
Active only toggle hides agents with no recent activity.
Jump to Now snaps the view to the current time.
Tag Clouds
Agents are grouped visually by tags on the Dashboard. Click a tag cloud to filter the view to that group.
Activity Feed
A real-time WebSocket-driven activity stream showing agent collaborations, task starts/completions, schedule executions, and errors.
For Agents
| Endpoint | Method | Description |
|---|---|---|
| /api/agents | GET | List all agents |
| /api/agents/context-stats | GET | Context and activity state for all agents |
| /api/agents/autonomy-status | GET | Autonomy status for all agents |
| /api/activities/timeline | GET | Cross-agent activity timeline (filterable) |
| /api/telemetry/host | GET | Host CPU/memory/disk |