Monitoring
Multi-layer health monitoring for the agent fleet with real-time alerts, automatic cleanup of stuck resources, and a fleet-wide health view on the Operations page.
Health Levels
Ordered by severity:
| Level | Meaning |
|---|---|
| healthy | All checks passing |
| degraded | Minor issues detected |
| unhealthy | Significant problems |
| critical | Immediate attention required |
| unknown | Unable to determine status |
Three Monitoring Layers
Docker layer — Container status, CPU/memory usage, restart count, OOM detection.
Network layer — Agent HTTP reachability with latency tracking.
Business layer — Runtime availability, context usage, error rates.
Heartbeat Liveness and Alert Cooldowns
Heartbeat Liveness: In addition to the periodic health-check loop, each running agent pushes a lightweight heartbeat to the backend every 5 seconds. See Agent Heartbeats below.
Alert Cooldowns: Repeated alerts for the same condition are throttled to prevent notification spam.
Health Tab (Operations Page)
Fleet health lives on the Health tab of the Operations page (/operations?tab=health). The tab is admin-only — non-admin users do not see it, and deep links to ?tab=health fall back to the default tab. The legacy /monitoring route redirects there.
The tab shows summary cards (Total Agents, Healthy, Degraded, Unhealthy, Critical), active alerts, and a per-agent health list with a status filter. Admins can trigger a fleet-wide check with Check All or a single-agent check from each row.
Enabling Monitoring
The periodic health-check loop is disabled by default. A status badge at the top of the Health tab shows the current state: "Monitoring Active" or "Monitoring Disabled", with an Enable monitoring / Disable monitoringbutton next to it (admin only) — no API call needed.
The same control is available via the API (admin only):
POST /api/monitoring/enable
POST /api/monitoring/disable
The choice is persisted, so it survives backend restarts — if monitoring was enabled, the loop resumes automatically on boot. The check interval and other options are configured via GET/PUT /api/monitoring/config, which also persists and applies the enabled flag.
Agent Heartbeats
Independently of the health-check loop, every running agent (on a current image) POSTs a small heartbeat to the backend every ~5 seconds, authenticated with its own agent-scoped MCP key. A backend watch loop acts on missed beats:
Each agent resolves to one of three heartbeat states:
| State | Meaning |
|---|---|
| alive | Beating normally |
| stale | Was beating, then stopped |
| unsupported | Agent runs an older image that never sent a beat — never treated as dead |
Heartbeat fields (heartbeat_state, heartbeat_alive, last_heartbeat_age_s, heartbeat_memory_mb, heartbeat_active_executions) surface on GET /api/monitoring/status for each agent. Heartbeats work even when the periodic monitoring loop is disabled.
Cleanup Service
A background service that automatically recovers stuck resources:
running row the agent does not know is orphaned only if no live backend dispatcher owns it either — an execution admitted and parked in the backend's agent-call queue, or accepted by the agent but not yet spawned, is left alone. Rows withheld this way are reported as dispatch_inflight_skipped in the cleanup report; they are not recoveries. A genuine orphan is marked failed with an error stating what was observed, and its slot is released.status='running' past its per-slot timeout is marked failed.activity_state='started' past the configured threshold is marked failed.failed immediately and their slots are released.A close the cleanup service fabricates records no duration — duration_ms is NULL, not a number computed from started_at. Earlier versions wrote a made-up duration, and on PostgreSQL a row older than about 25 days overflowed the column and rolled back the whole sweep, so nothing stale was ever closed again while the cycle still logged "complete". If you upgrade an instance in that state, the restart's startup recovery closes those rows; no manual SQL is needed.
Retention Sweeps
The same cleanup service runs retention sweeps to keep the database lean. Setting any window to 0 disables that sweep — except backup_retention_days, where 0 is rejected (disable backups with DB_BACKUP_ENABLED=false instead).
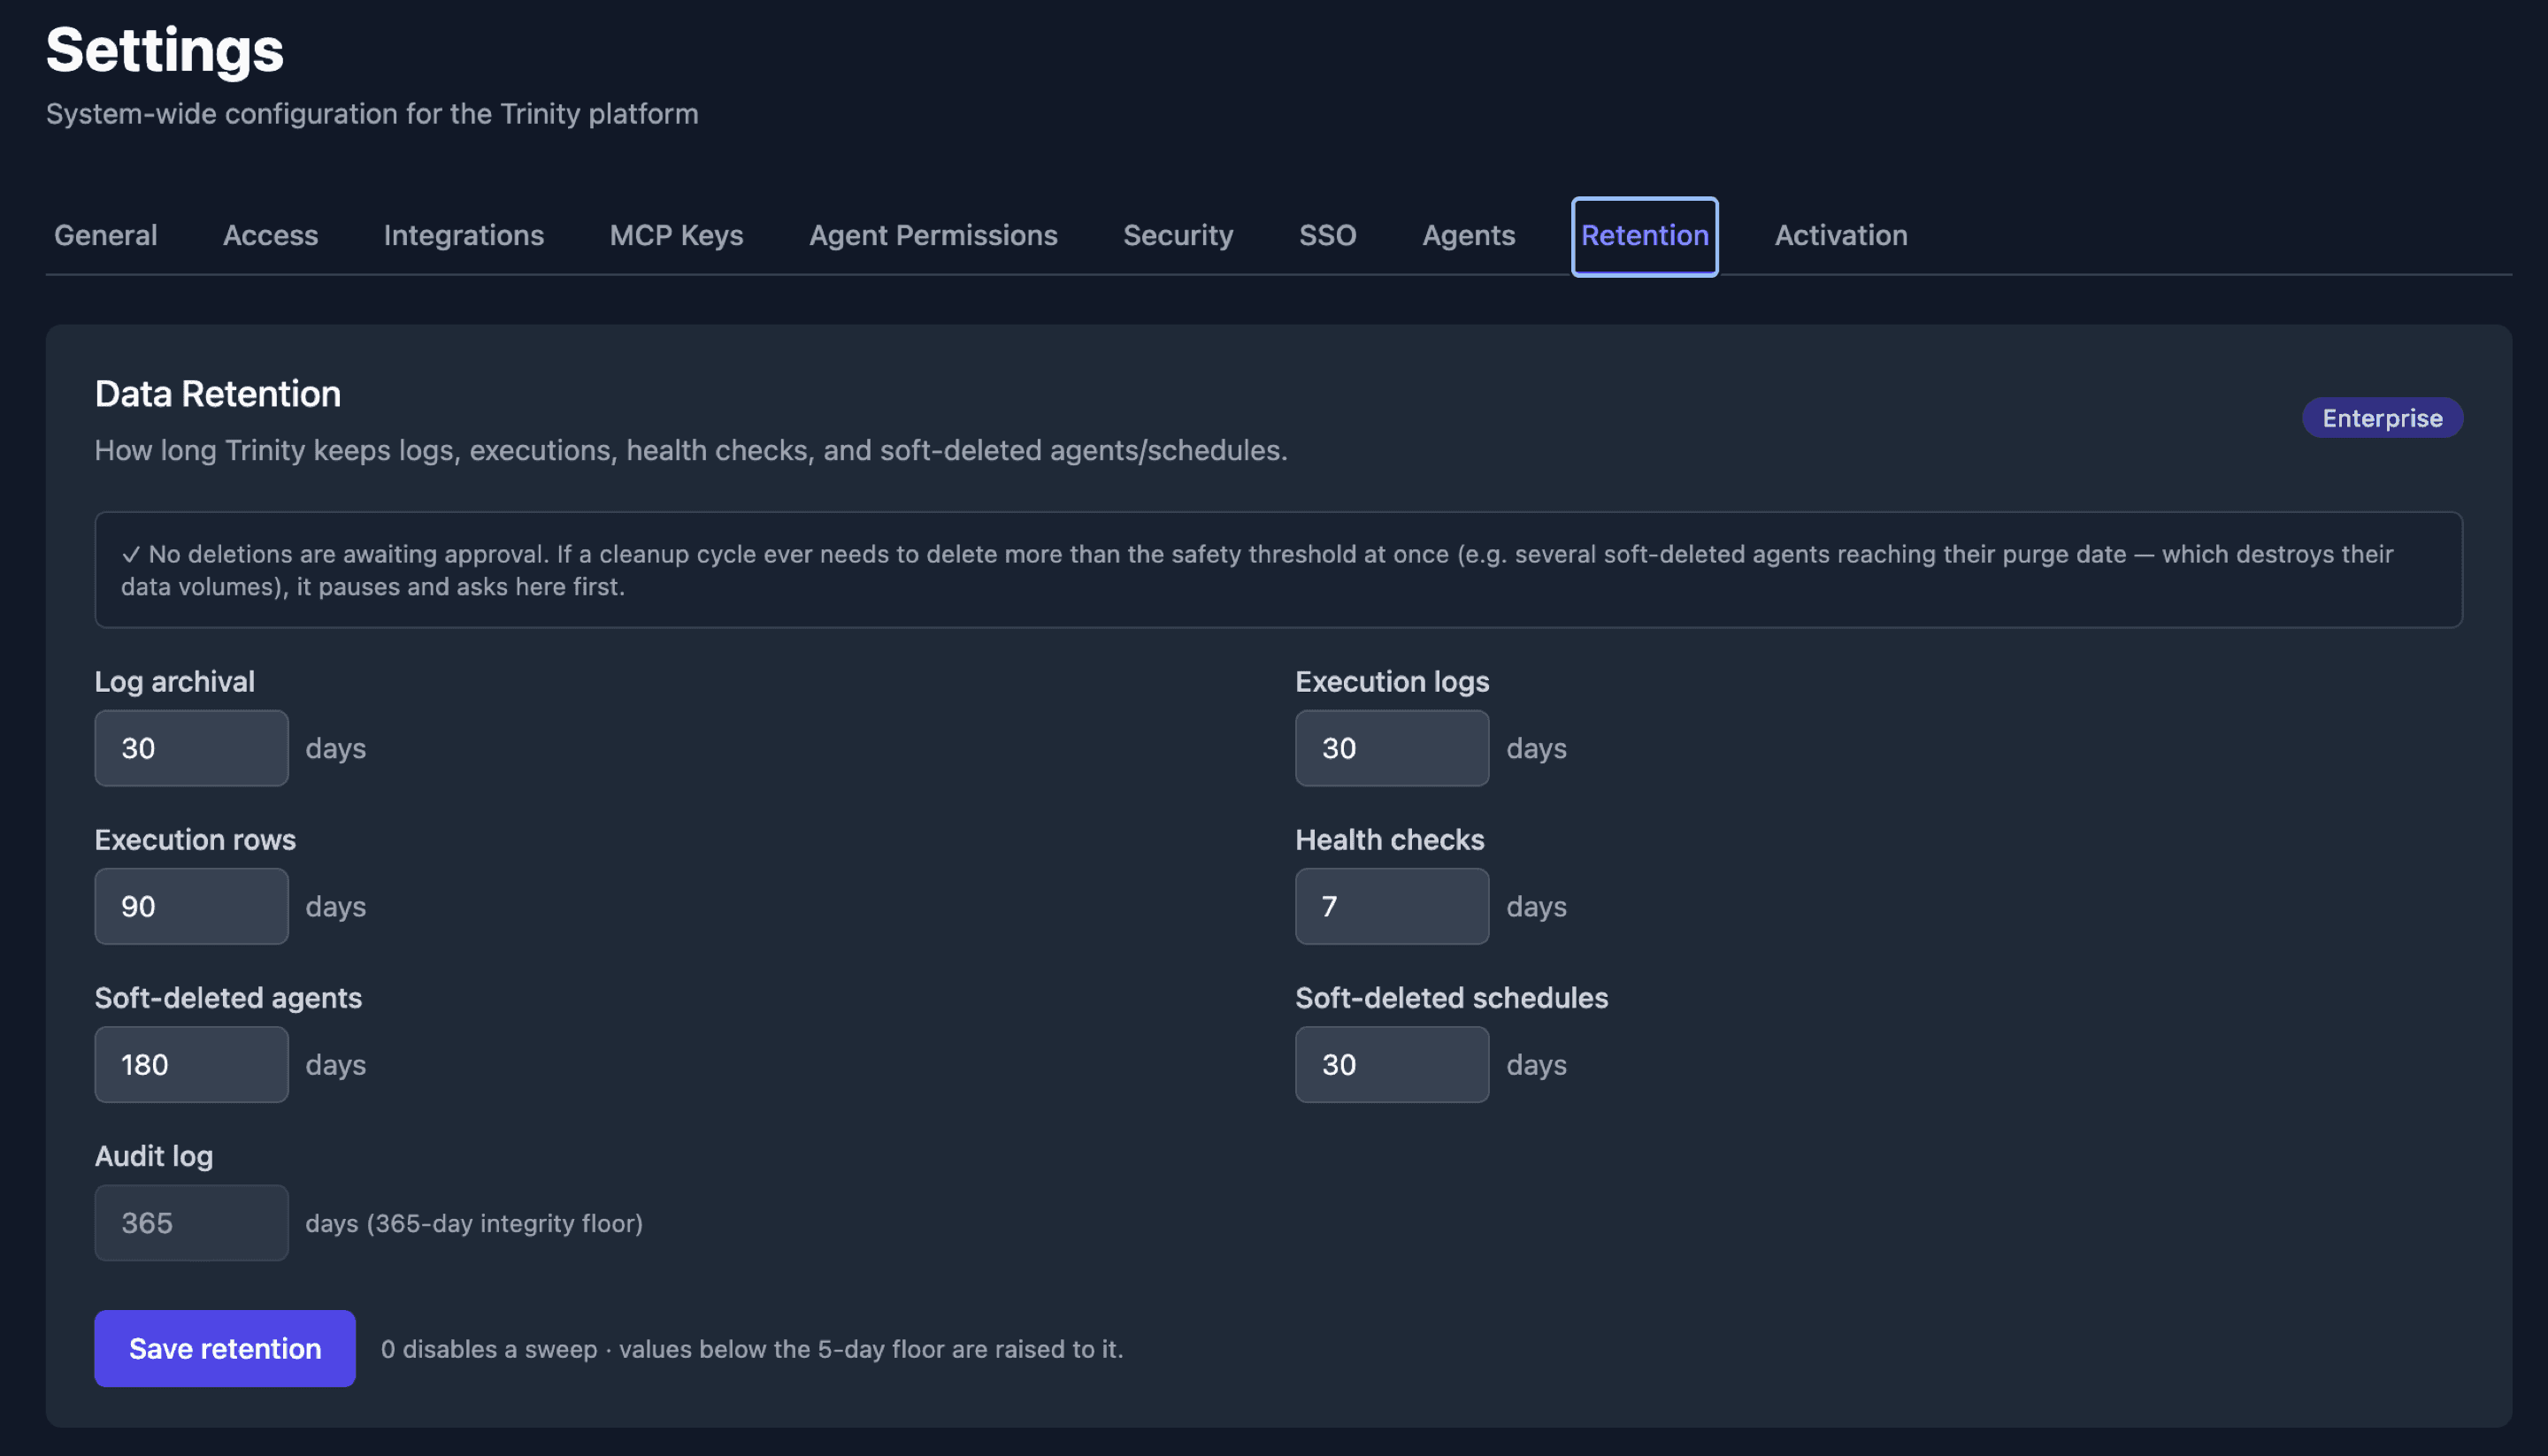
| Sweep | Default | Setting |
|---|---|---|
schedule_executions.execution_log nulled past | 30 days | execution_log_retention_days |
Terminal schedule_executions rows deleted past | 90 days | execution_row_retention_days |
agent_health_checks rows deleted past | 7 days | health_check_retention_days |
| Agent soft-delete purged past | 180 days | agent_soft_delete_retention_days |
| Schedule soft-delete purged past | 30 days | schedule_soft_delete_retention_days |
| Agent reports deleted past | 90 days | agent_reports_retention_days |
| Terminal operator-queue rows deleted past | 90 days | operator_queue_retention_days |
| Terminal agent reminders (fired/cancelled/failed) deleted past | 90 days | agent_reminders_retention_days |
| Subscription headroom probe history deleted past | 30 days | subscription_headroom_retention_days |
| Subscription rate-limit / auth failure events deleted past | 30 days | subscription_failure_event_retention_days |
| Database backup files deleted past | 14 days | backup_retention_days (1–3650; the newest 3 are always kept) |
audit_log rows deleted past | 365 days | AUDIT_LOG_RETENTION_DAYS (floor 365, exempt) |
The agent soft-delete purge is special: it destroys the agent's data volumes, so it is a recovery window, not a log window — it is exempt from the community floor below.
The 5,000-row figure some tooling reports bounds each transaction, not each sweep. Most prunes drain the whole candidate set in one sweep; the real bound on destruction is the blast-radius guard below, not chunking. A daily VACUUM at 04:30 UTC reclaims freed pages.
Community Floor (Fresh Installs)
Fresh community installs are seeded with a 5-day minimum retention on the log windows. This applies to new installs only— it is never a retroactive change to an existing install, and the agent soft-delete window is exempt in every edition. Any admin can widen a window at any time.
Every Install Owns Its Windows
On every boot, Trinity writes an explicit row for any retention window that has none, at the value already in force — upgraded installs included, not just fresh ones. Nothing prunes differently the day this happens. The consequence is that retention is per-install configuration: a later change to the built-in defaults, in either direction, never silently changes how much data an existing install keeps. GET /api/settings/retention therefore reports every window with source db-row.
Blast-Radius Guard and Admin Approval
A sweep that would delete more than a fixed safety threshold (1,000 rows) of a single table refuses to run, logs an error, and raises an operator-queue alarm instead of deleting. An admin must then approve it in Settings → Retention, which shows a Deletion awaiting your approval banner with an Approve deletion button per pending prune.
The approval is:
Agent-purge sweeps always require an acknowledgement because every one destroys data volumes.
Changing a Window
Retention windows have exactly one write path: PUT /api/settings/ops/config, reached from Settings → Retention. It type- and range-validates every value all-or-nothing (one bad value rejects the whole request with a 422) and writes an audit entry naming which windows moved. The generic settings endpoint refuses these keys and points you here.
Two things worth internalising, because the risk is counter-intuitive:
0, which disables the sweep and retains forever.1 is well-formed and in range, and no range check can distinguish it from an operator who genuinely wants a one-day window. Validation buys you a loud failure instead of a silent coercion; what actually stops an accidental mass deletion is the blast-radius guard above and the admin-plus-human gate on approving it.Reset to defaults (POST /api/settings/ops/reset) deliberately skipsretention windows — resetting other operator settings must never silently change how much of your data is kept. The reset is itself audit-logged.
Endpoints:
| Endpoint | Method | Description |
|---|---|---|
| /api/settings/retention | GET | Effective windows (per-window value + source), edition, community-floor days, the read-only guard threshold, and pending acknowledgements (admin) |
| /api/settings/ops/config | PUT | The single validated, audited write path for retention windows (admin) |
| /api/settings/retention/acknowledge | POST | Approve one over-threshold prune — body {key, window_days} (admin, human-only) |
Real-Time Event Reliability
Trinity uses a Redis Streams-backed event bus for all WebSocket delivery. This is invisible during normal operation but has operator-visible behaviour in a few edge cases.
Reconnect Replay
When a browser tab reconnects after a brief disconnect (e.g., laptop sleep, flaky network), it automatically requests missed events using a ?last-event-id= cursor tracked in memory. Events are replayed from the Redis stream, so the collaboration dashboard, activity timeline, and operator queue resume without stale state.
resync_required Events
If the cursor is too far behind (>5,000 events missed) or the stream has been trimmed past the stored cursor, the server sends a {"type": "resync_required"} message. The frontend clears the cursor and refetches authoritative state via REST. Users see a brief refresh but no data loss.
The stream retains approximately the last 10,000 events (configurable via REDIS_STREAM_MAXLEN in .env).
Admin Stats Endpoint
For soak monitoring and diagnosing delivery issues:
GET /api/debug/event-bus-stats (admin-only)Returns counters since last backend restart:
| Field | What to check |
|---|---|
| publisher.events_published | Total events emitted |
| dispatcher.drops_queue_full | Events dropped due to slow clients |
| dispatcher.clients_evicted | Connections closed after 3 consecutive send failures |
| dispatcher.resyncs_sent | Forced full-state refreshes sent to clients |
| watchdog.cumulative_orphaned | Orphaned executions recovered by cleanup service |
Healthy baseline: drops_queue_full + clients_evicted + resyncs_sent should be < 0.1% of events_published. Non-zero cumulative_orphaned warrants investigation.
MCP Tools
Agents can query monitoring data through these MCP tools:
| Tool | Description |
|---|---|
| get_fleet_health() | Fleet-wide health summary |
| get_agent_health(name) | Individual agent health |
| trigger_health_check() | Force an immediate health check |
API Endpoints
| Endpoint | Method | Description |
|---|---|---|
| /api/monitoring/status | GET | Fleet health summary (includes heartbeat_* fields) |
| /api/monitoring/agents/{name} | GET | Single-agent health detail |
| /api/monitoring/agents/{name}/check | POST | Force immediate health check |
| /api/monitoring/enable | POST | Start the health-check loop; persisted (admin) |
| /api/monitoring/disable | POST | Stop the health-check loop; persisted (admin) |
| /api/monitoring/config | GET/PUT | Monitoring configuration, including the enabled flag (admin) |
| /api/monitoring/check-all | POST | Trigger a fleet-wide health check (admin) |
| /api/monitoring/cleanup-status | GET | Cleanup service status (admin) |
| /api/monitoring/cleanup-trigger | POST | Force a cleanup run (admin) |
| /api/agents/{name}/heartbeat | POST | Agent liveness heartbeat (sent by the agent itself every ~5s) |